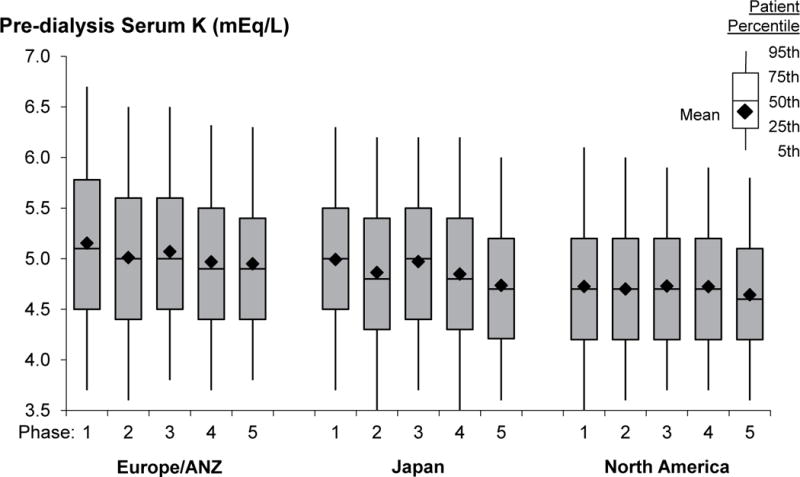
Figure 2b. Temporal trends in pre-dialysis serum K by DOPPS region (1996–2015).

N=67,263 patients. DOPPS phase 1: 1996–2001, phase 2: 2002–2004, phase 3: 2005–2008, phase 4: 2009–2011, phase 5: 2012–2015. A/NZ=Australia and New Zealand. Note that countries recently joining the DOPPS in phase 5 (N=3,334 patients) are not represented in this figure.
