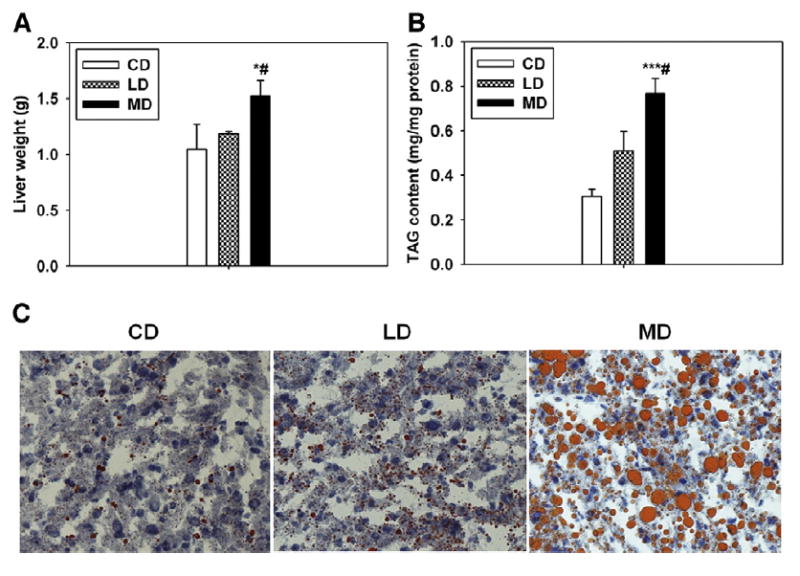
Fig. 1.

Dietary fat composition determines the severity of hepatic steatosis in mice. Liver weights (A) and TAG content in the livers of mice fed with different diets at 16 weeks of feeding (B). n = 3 to 6. C, Representative micrographs of the ORO staining. n = 3. *P < .05 and ***P < .001 vs CD, respectively; #P < .05 vs LD. The results are presented as the means ± SEM.
