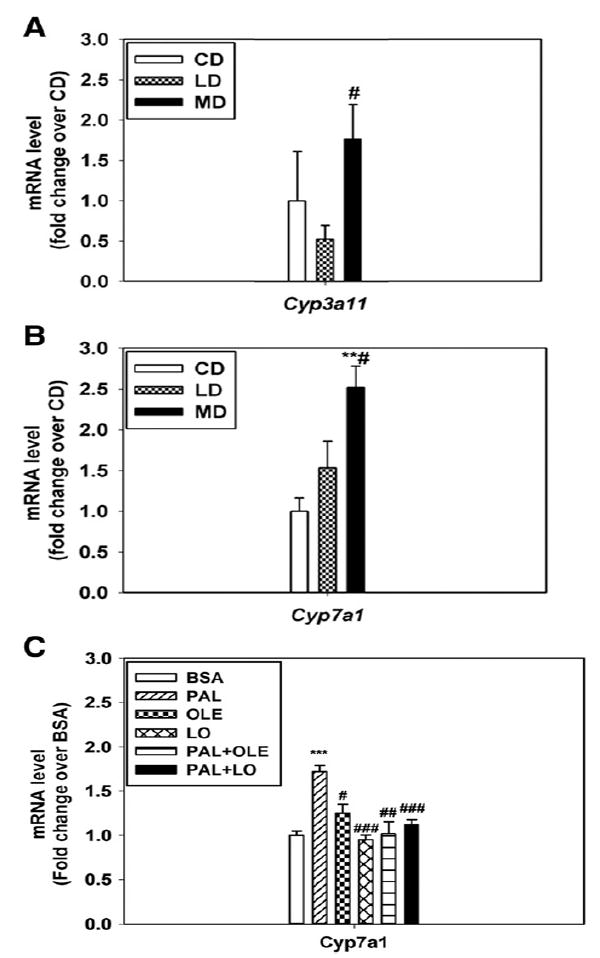
Fig. 6.

Differential expression of CYP3a11 and CYP7a1 in the livers of mice or HepG2 cells treated with SFA vs UFA. Message levels of CYP3a11 (A) and CYP7a1 (B) were differentially expressed in the livers of mice fed with LD vs MD; n = 3 to 6; **P < .01 vs CD, #P < .05 vs LD. C, Message levels of CYP7a1 were differentially regulated in cultured HepG2 cells treated with 0.625 mmol/L PAL with or without OLE/LO. Cells treated with BSA were used as the control. n = 5. ***P < .001 vs BSA; ##P < .01, ###P < .001 vs PAL, respectively. The results are presented as the means ± SEM.
