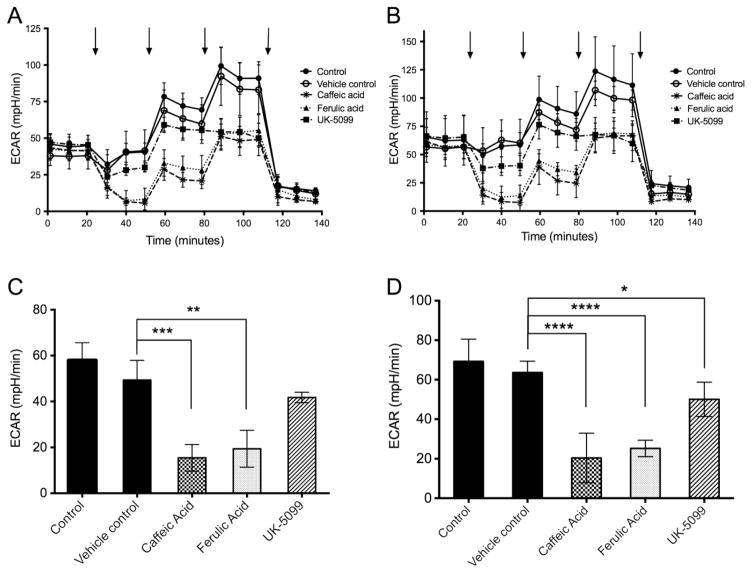
Figure 1.
Assay of N1-S1 rat hepatoma cells using Seahorse analyzer. Extracellular acidification rate (ECAR) was measured in parallel on four technical replicates for each condition (A), and average values plotted. The entire experiment was replicated independently (B), again with four samples in parallel for each condition. Untreated control, closed circles; vehicle (DMSO) treated, open circles; UK-5099, closed squares; ferulic acid, closed triangles; caffeic acid, astericks. The compounds or DMSO were added at 20 min and remained present throughout the remainder of the assay. Additions indicated by arrows at 50, 80 and 110 min were 20 mM glucose, 1 uM oligomycin, and 80 mM 2-deoxyglucose, respectively. The net ECAR under glucose challenge for each experiment (panels C and D, corresponding to A and B) was calculated from the difference between values with 20 mM glucose (50–80 min) and 80 mM deoxyglucose (120–140 min). * P,0.05, **, p<0.01, *** p< 0.001 and **** p< 0.0001.

