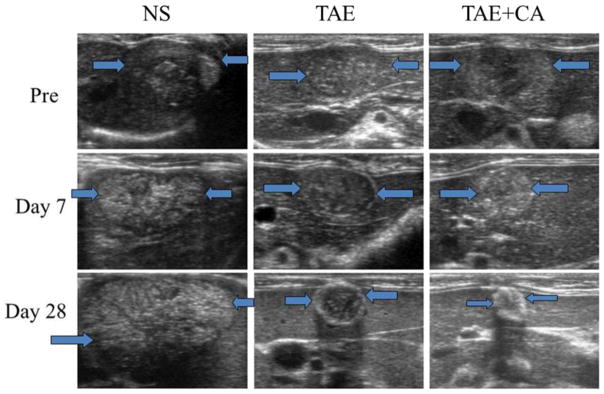
Figure 3.
Representative ultrasound (US) images of normal saline control group (NS), embolization only group (TAE), and embolization with caffeic acid group (TAE+CA) at day 0, 7, and 28. Note significant decrease in size of the TAE+CA group when compared with NS and TAE groups. TAE+FA groups showed similar decrease in size and changes in echogenicity when compared to TAE+CA.

