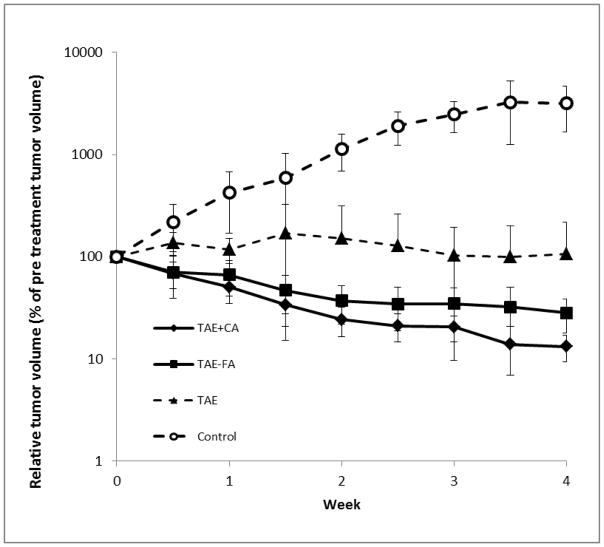
Figure 4.
Graph of logarithm of relative liver tumor volume determined by ultrasound vs. time in weeks. Groups TAE+CA and TAE+FA had n = 5 and TAE had n = 4 for the duration of the study. Control group started with n = 5 but due to tumor burden 2 animals were euthanized on day 14 and 1 animal on day 24. The average volumes in each group were calculated at each day of observation. Both TAE+CA and TAE+FA groups demonstrated a statistically highly significant (p <0.0001) decrease in tumor size when compared to initial volumes in the same animals. Key to symbols is shown in Figure..

