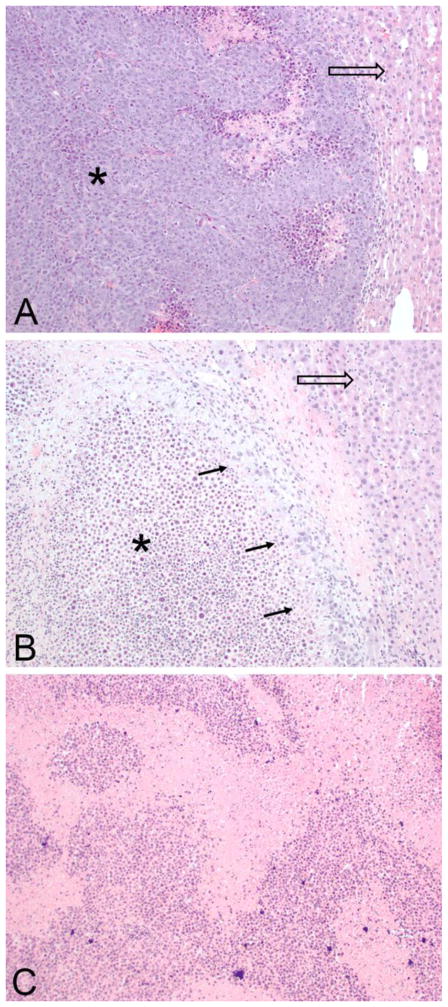
Figure 5.
Representative histopathologic microscopic images of livers. (A) A control specimen stained by H&E, imaged at 100x magnification showing extensive tumor (*) with necrosis and adjacent liver tissue (arrow). No peritumor inflammation or fibrosis noted. Surrounding liver shows no inflammatory changes or bile duct proliferation. (B) Specimen from embolization group (TAE) shows a majority of necrotic tumor (*) with rim of viable tumor cells (arrows) adjacent to normal liver (hollow arrow). No evidence of peritumor inflammation or bile duct proliferation. (C) Representative specimen from embolization with caffeic acid (TAE+CA) shows entirely necrotic appearance of tumor area with no evidence of viable tumor. Background liver shows no inflammatory changes or bile duct proliferation (not imaged).

