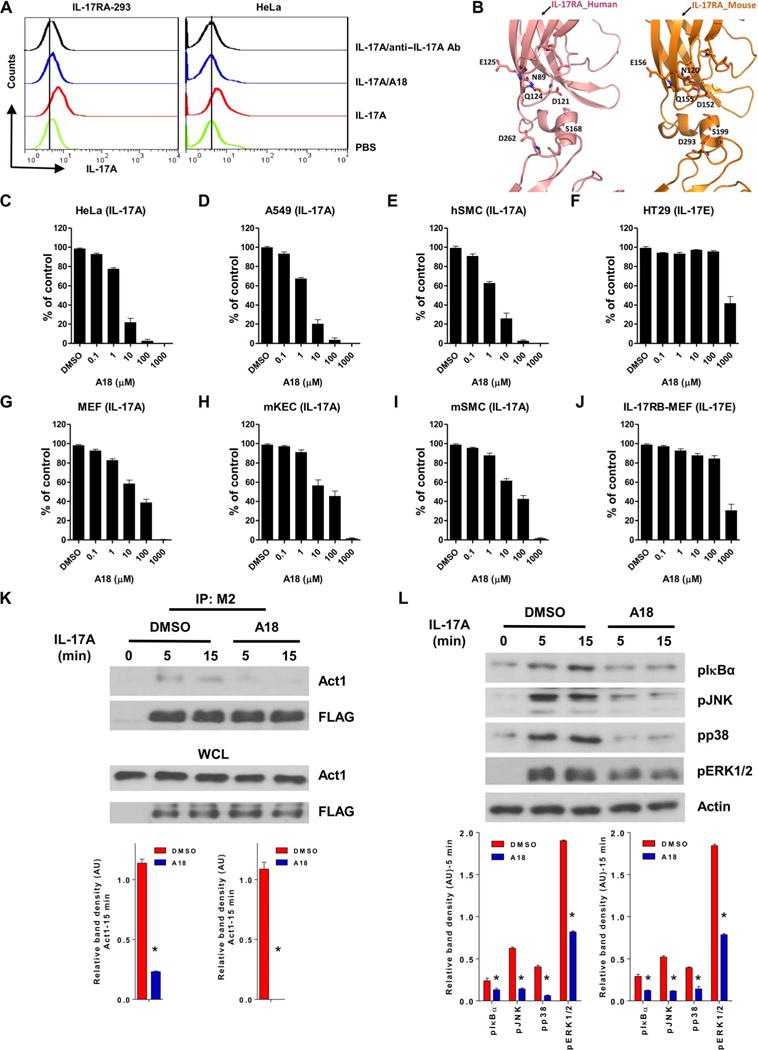
Fig. 2. A18 specifically inhibits IL-17A–induced gene expression and signaling in human and mouse cells.

(A) Flow cytometric analysis of HEK 293 cells stably expressing IL-17RA (IL-17RA–293; left) and HeLa cells (right) incubated with PBS or with biotinylated IL-17A in the presence of PBS, A18, or anti-human IL-17A antibody. Cells were incubated with avidin-fluorescein before being subjected to flow cytometric analysis. Data are representative of three experiments. (B) Comparison of the binding pockets of human (left) and mouse (right) IL-17RA. The model of mouse IL-17RA was generated with I-TASSER software (50). (C to J) The indicated human (C to F) and mouse (G to J) cell types were treated for 24 hours with IL-17A or IL-17E, as indicated, in the presence of DMSO (vehicle control) or the indicated concentrations of A18. The concentrations of CXCL1 (GROα in humans and KC in mice) in the culture medium were measured by enzyme-linked immunosorbent assay (ELISA). Results are presented as a percentage of the amount of CXCL1 in the culture medium of IL-17–stimulated, DMSO-treated cells, which was set at 100%. Data are representative of four independent experiments. Error bars represent the SEM of technical replicates. (K) HeLa cells were transfected with plasmid encoding FLAG-tagged WT IL-17RA. Forty-eight hours later, the cells were pretreated with DMSO or 10 μM A18 before being incubated for the indicated times with IL-17A. Top: Whole-cell lysates (WCLs) were subjected to immunoprecipitation (IP) with an anti-FLAG antibody (M2) and then were analyzed by Western blotting with anti-Act1 and anti-FLAG antibodies. Western blots are representative of three independent experiments. Bottom: The relative densities of the bands corresponding to Act1 in the immunoprecipitated samples were normalized to those in the WCLs. Data are means ± SEM of three independent experiments. (L) HeLa cells were pretreated for 1 hour with DMSO or 10 μM A18 before they were treated for the indicated times with IL-17A. The cells were then analyzed by Western blotting with antibodies against the indicated proteins. Top: Western blots are representative of three independent experiments. Bottom: The relative densities of the bands corresponding to pIκBα, pJNK, pp38, and pERK1/2 were normalized to that of actin. Data are means ± SEM of three independent experiments. hSMC, human smooth muscle cell; mSMC, mouse smooth muscle cell; mKEC, mouse kidney epithelial cell. AU, arbitrary units. *P < 0.05 when comparing DMSO-treated cells with A18-treated cells.
