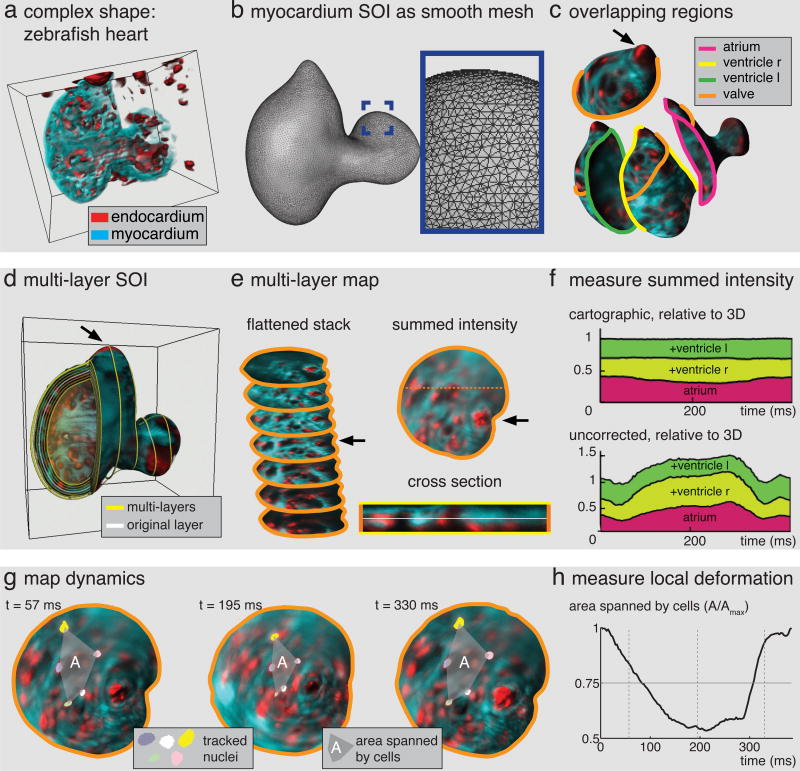
Fig. 3. Tissue cartography for a complex dynamic surface.
(a) Zebrafish heart, red: endocardium, cyan: myocardium. (b) Smooth triangulation of myocardium Surface Of Interest. Inset shows zoom into highlighted region on atrium. (c) Overlapping regions on SOI, solid lines indicate region boundaries. For clarity, only the orange boundary is shown on the other regions. Arrow indicates valve. (d) Multi-layer SOI for zebrafish heart in (a), yellow lines indicate layers. White layer highlights surface in (b). (e) Conformal maps from orange region to plane for multiple layers arranged in flattened stack. Summed intensity projection on right with position of cross section below indicated by dashed line. In cross section, layer in (c) is highlighted in white. (f) Cartographic intensity measurements from different layers and regions add up faithfully for all times. Top: total intensity of regions in (c) for all layers, excluding overlap, normalized by 3D summed intensity within surface mask. Bottom: uncorrected summed intensity shows large error. Colors match region colors in (b). (g) Maps vary smoothly with time. Three time points show a group of tracked nuclei connected by a dashed line. (h) Area enclosed by tracked cells over time, normalized by maximum.

