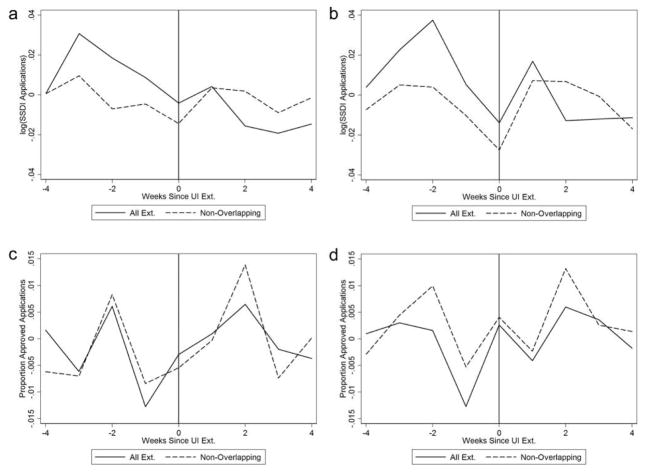
Fig. 7.
Extent Event studies of new UI extensions on weekly applications to Social Security Disability Insurance (SSDI) and acceptance rates, by duration of UI extension and overlap with prior UI extensions. a, log(SSDI applications)—all extensions; b, log(SSDI applications)— 13+ week extensions; c, acceptance rate—all extensions; d, acceptance rate—13+ week extensions. Figure reports coefficients on dummies for weeks before or after a UI extension from regressions that include state and week fixed effects and cubic polynomials in the weekly insured unemployment rate and the monthly state unemployment rate. Panels b and d include lead and lag dummies only for extensions providing 13 or more weeks of additional benefits. Dashed series in each panel include lead and lag dummies only for extensions that do not occur within k weeks following a k-week prior extension, for any k. Coefficients are reported in appendix tables A2 and A3.

