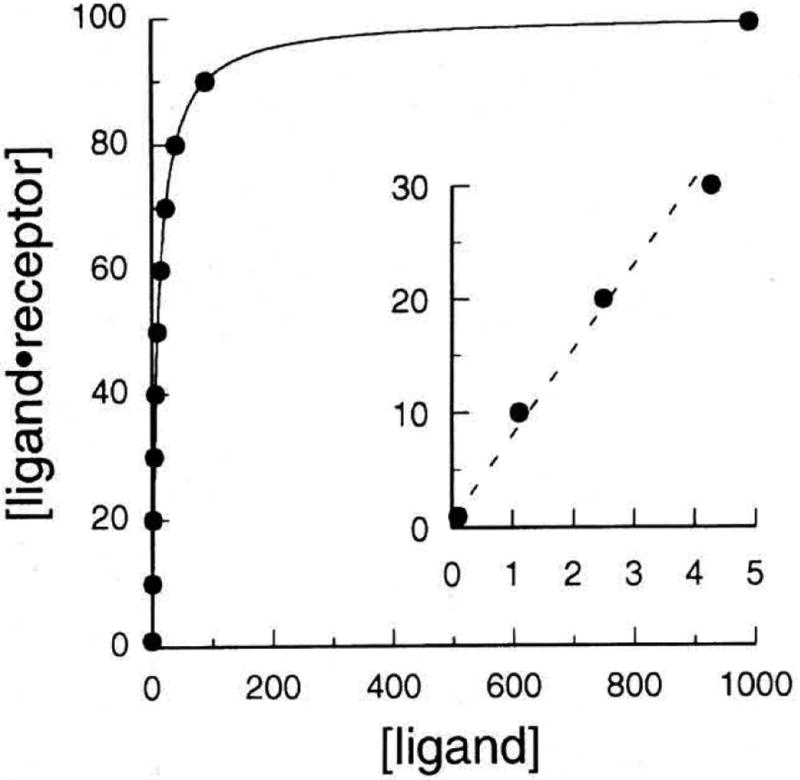
Figure 1.

Typical saturation curve for a receptor–ligand interaction. The curve was generated from an interaction with Bmax = 100; Kd = 10; F = 0.10, 1.1, 2.5, 3.9, 4.3, 6.7, 10, 15, 23, 40, 90, 990. The insert shows that the binding observed at row concentrations of ligand (F < Kd/2) appears linear and therefore might erroneously be interpreted as nonspecific.
