Figure 2.

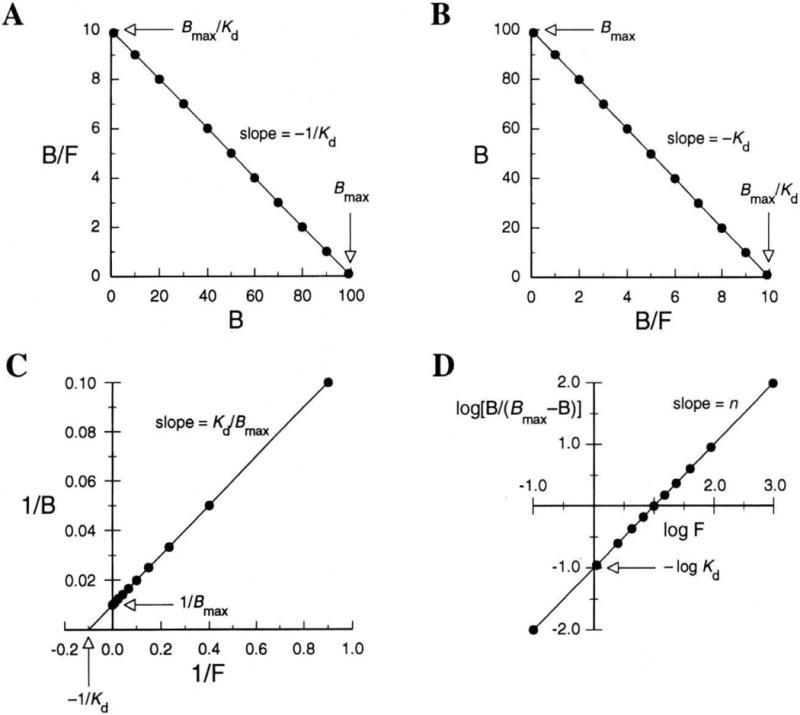
Linear transformations of binding data for the receptor–ligand interaction portrayed in Figure 1. (A) Scatchard plot; (B) Eadie–Hofstee plot; (C) double-reciprocal plot (F = 0.10 not shown); and (D) Hill plot (n = 1).

Linear transformations of binding data for the receptor–ligand interaction portrayed in Figure 1. (A) Scatchard plot; (B) Eadie–Hofstee plot; (C) double-reciprocal plot (F = 0.10 not shown); and (D) Hill plot (n = 1).