
Fig. 4.
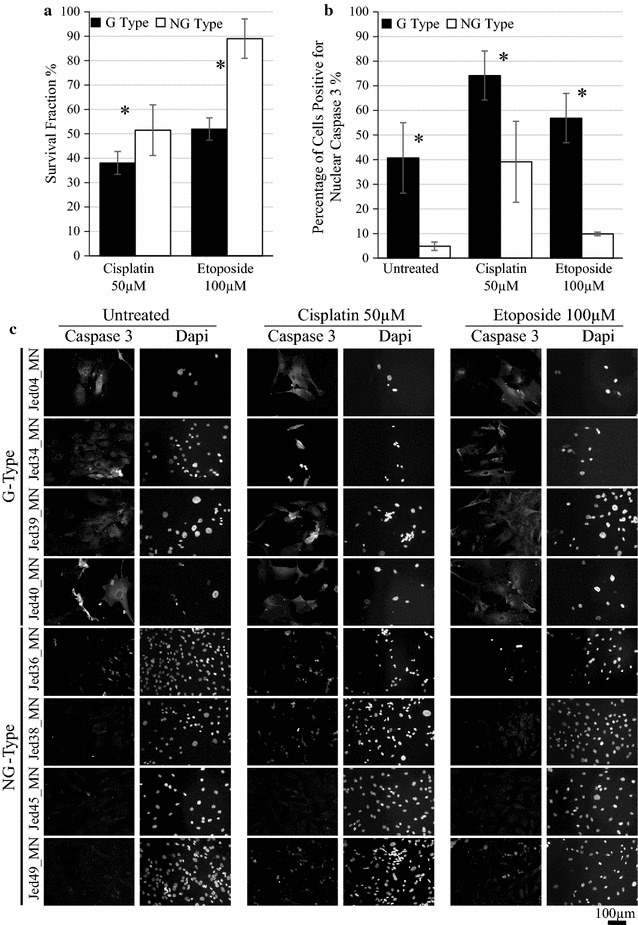
Cell lines’ tolerance to cisplatin and etoposide. a Survival fraction of cell lines measured 12 days following treatments. b The percentages of cells positive for nuclear Caspase-3 in untreated and drug treated cells 24 h following treatments. c Immunofluorescence images of Caspase-3 stained cells for four G Type cell lines (Jed04_MN and Jed34_MN, Jed39_MN and Jed40_MN) and four NG Type cell lines (Jed36_MN, Jed38_MN, Jed45_MN, Jed49_MN), 24 h following treatments. Bars indicate average counts of cell lines for each group, and error bars represent the SEM. *P < 0.05