
Fig. 5.
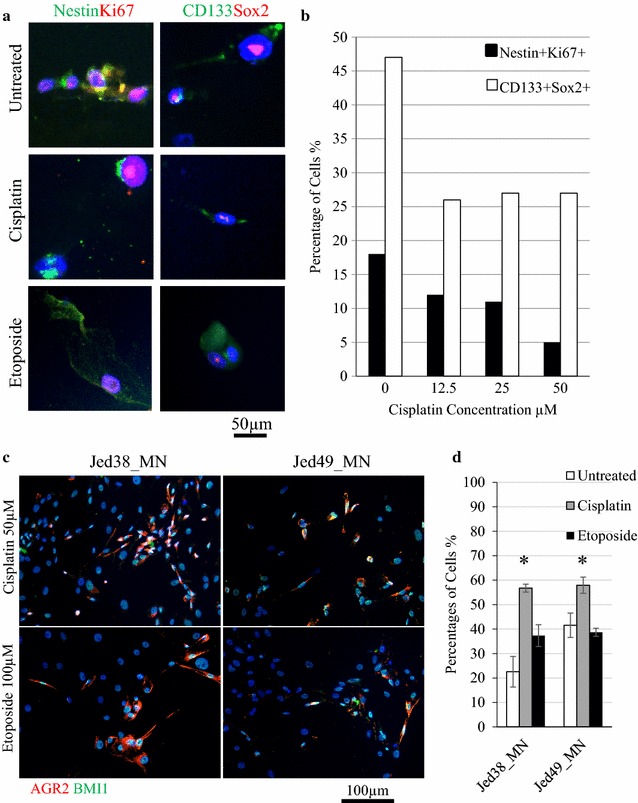
Cancer stem cells in NG cell lines survive cisplatin and etoposide treatment. a Immunofluorescence images of Jed49_MN survived cells positive for CD133+ Sox2+ (green, red) or Nestin+ Ki67+ (green, red). b Counts for survived cells treated with increasing concentrations of cisplatin and co-stained with CD133+ Sox2+ (white bars) or with Nestin+ Ki67+ (black bars). 100 cells were counted per concentration. c Immunofluorescence images of Jed38_MN, and Jed49_MN following treatment with either cisplatin or etoposide (100 µM) showing co-staining of AGR2 (red) with the oncogenic marker BMI1 (green). d Percentages of cells co-express AGR2 and BMI1 in treated cells. Error bars represent errors between three independent counts of 100 cells. Asterisk represents P < 0.05