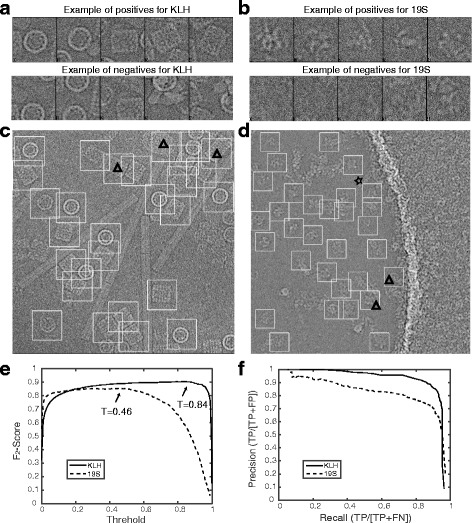
Fig. 3.

The DeepEM results for the KLH and 19S regulatory particle datasets. a and b Examples of positive and negative particle images selected for the CNN training in conjunction with the KLH and 19S datasets, respectively. c and d Typical micrographs from the KLH and 19S datasets, respectively. The white square boxes indicate the positive particle images selected by DeepEM. The boxes with a triangle inside indicate that a false-positive particle image was picked. The star marks one example of a false negative, a true particle missed by the recognition program. e The F 2-score curves provide different thresholds for particle recognition in the KLH and 19S datasets, the arrows indicate the peaks of each curve, where the cutoff threshold value is defined. f The precision-recall curves plotted against a manually selected list of particle images
