
Fig. 2.
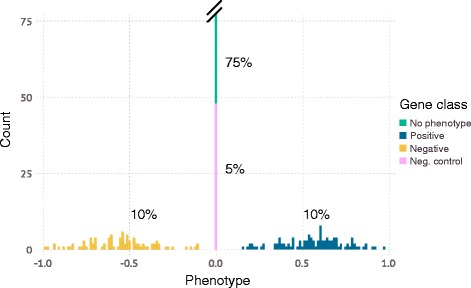
Phenotype distribution in an example simulated genome. A typical distribution is shown, which includes 75% of genes without phenotype (green), 5% of negative control genes (pink), 10% of genes with a positive phenotype (blue), and 10% of genes with a negative phenotype (yellow). The frequencies of each category and strengths of the phenotypes are set by the user and are library specific (see text for more details). N genes are randomly given phenotypes from this artificial genome and used in later steps of the simulation