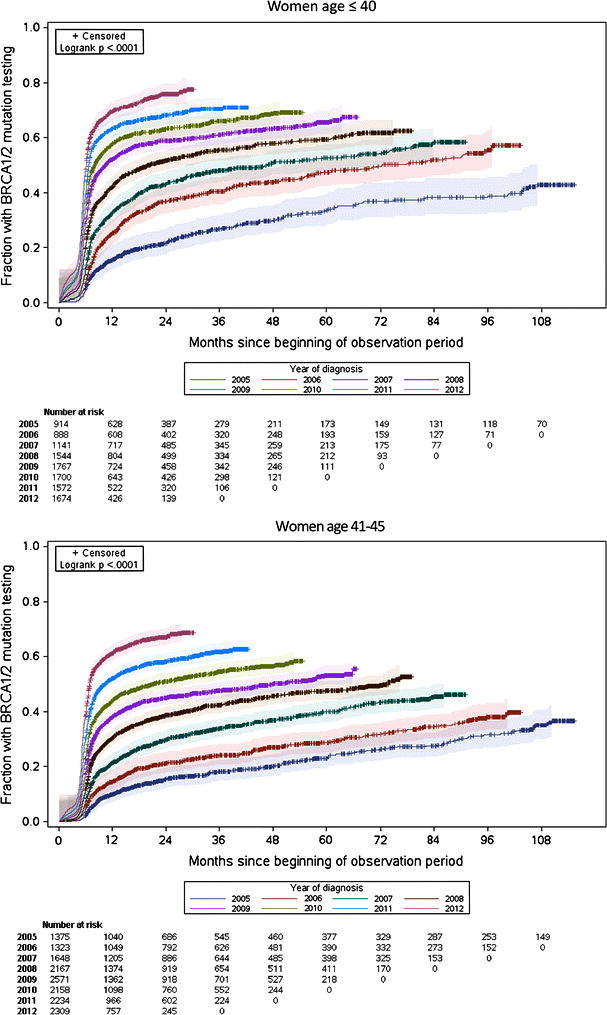
Figure 1. Cumulative rates of BRCA1/2 testing claims*.

*Each graph contains Kaplan-Meier failure curves, where events were defined as BRCA1/2 testing claims. The year of diagnosis was defined as the year in which breast cancer surgery occurred; the ascertainment period began 180 days before the date of breast cancer surgery. Patients were censored on the date they no longer had continuous insurance coverage recorded within the MarketScan database. The shaded areas represent 95% Hall-Wellner confidence bands for each curve.
