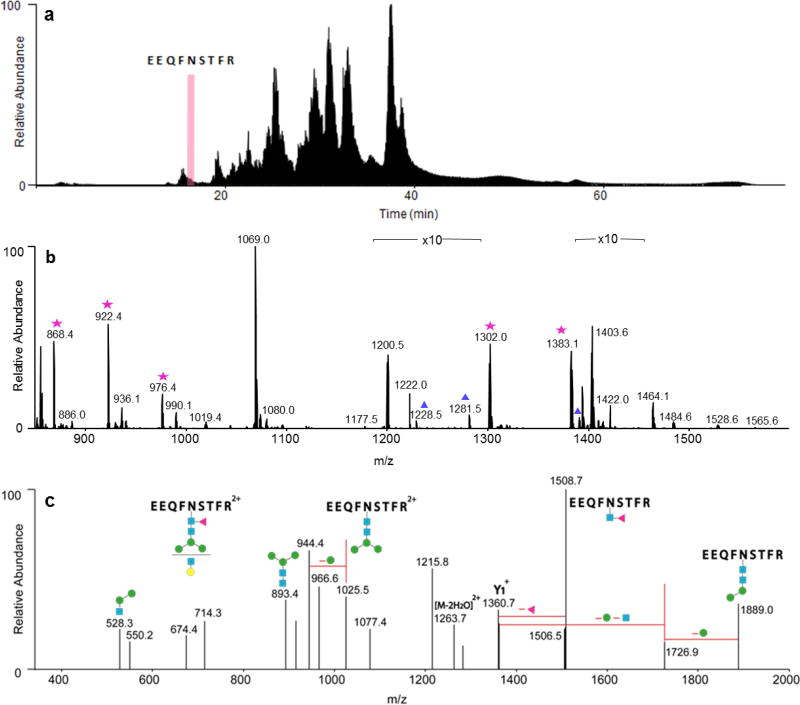
Fig. 2.
Example data from Inclusion experiment. a Ion chromatogram of the IgG glycoprotein digest, indicating where one of the peptides, EEQFNSTFR, elutes. b MS data for the highlighted region in a. Stars: Glycopeptide selected for MS/MS by Inclusion and Top 10. Triangles: Glycopeptides selected for MS/MS only by Inclusion but not by Top 10. c The CID spectrum of a glycopeptide that was only selected by Inclusion. The ion, m/z 1281.52, corresponds to EEQFNSTFR+[Hex]4[HexNAc]3Fuc]1. Its composition can be confirmed by the product ions in c. Blue squares: N-acetylhexosamines. Red triangle: fucose. Green and yellow circles: hexoses

