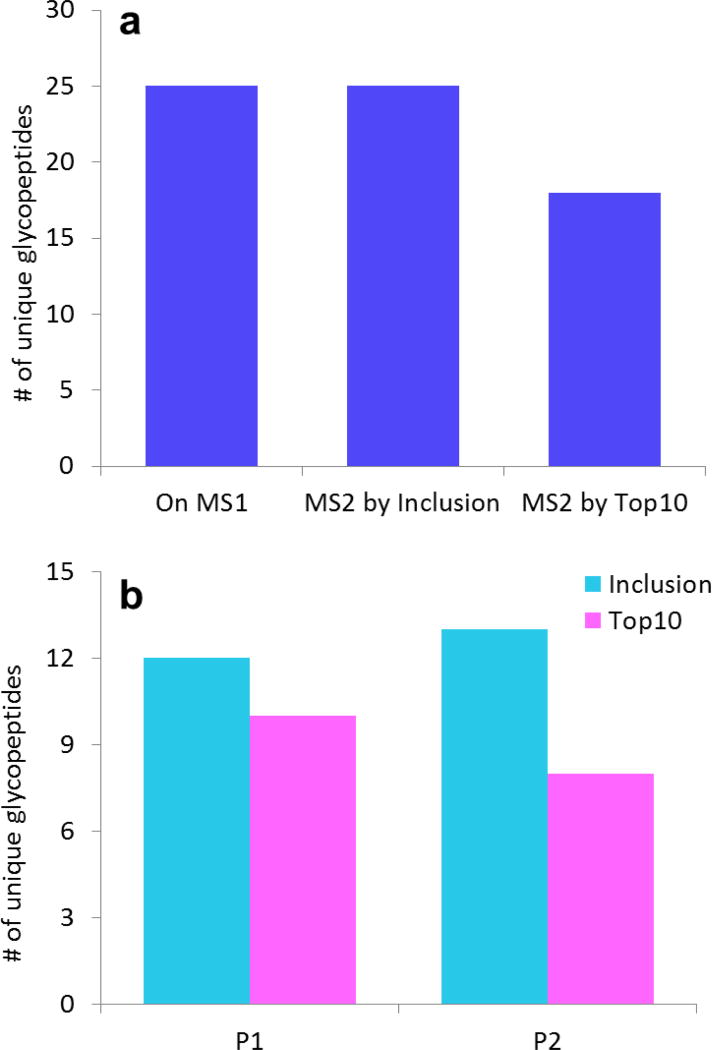
Fig. 3.
IgG glycopeptides selected for CID by Inclusion or Top 10 experiments. a Comparison of the total number of unique glycopeptides observed in the high resolution MS data vs. those that were selected for CID during Inclusion or Top 10. Top 10 got 100% coverage and selected seven more glycopeptides (39% more) than Top 10. b The number of unique glycopeptides from each site selected for MS/MS by Inclusion and Top 10. P1=EEQYNSTYR. P2=EEQFNSTFR. For P2, a greater advantage was observed because the chromatogram had more co-eluting interferents in this region that were selected for MS/MS by the Top 10 experiment

