
Figure 3. Relative abundance of phyla in cecal samples.
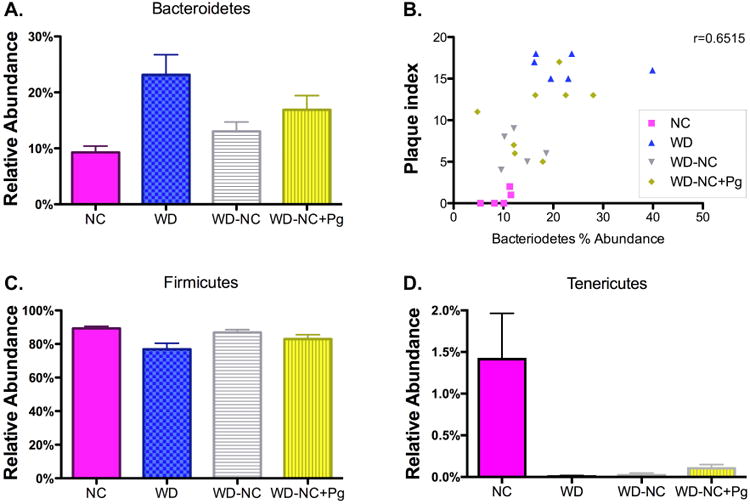
A. Phylum Bacteroidetes (family S24-7). Data were analyzed by one-way ANOVA (p=0.0128). B. Linear correlation between plaque index and relative abundance of phylum Bacteroidetes (S24-7) in cecal samples. Pearson r = 0.6515, p=0.0006. C. Phylum Firmicutes. Data were analyzed by one-way ANOVA (p=0.0245). D. Phylum Tenericutes. Data were analyzed by one-way ANOVA (p=0.0007). NC=normal chow for 22 weeks (n=5), WD=Western diet for 22 weeks (n=6), WD-NC=Western diet for 11 weeks followed by normal chow for 11 weeks (n=6), WD-NC+Pg=Western diet for 11 weeks followed by normal chow for 11 weeks and P. gingivalis oral infection at midpoint (n=8).