
Figure 3. TFEB-associated ACSS2 binds to the promoter regions of lysosomal and autophagy genes and promotes expression of these genes.
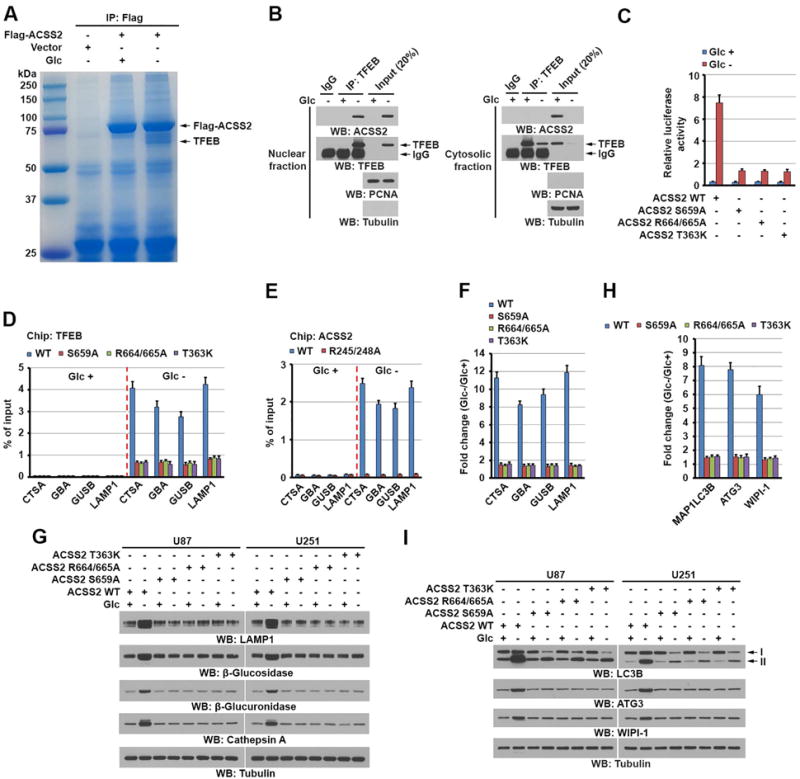
(B, G and I) Immunoblotting analyses with the indicated antibodies were performed.
(A) U87 cells with or without expressing Flag-ACSS2 were deprived of glucose for 1 h. Immunoprecipitates of Flag-ACSS2 with an anti-Flag antibody were separated using sodium dodecyl sulfate (SDS)-polyacrylamide gel electrophoresis (PAGE) and stained with Coomassie Brilliant Blue. The indicated protein band was excised for mass spectrometric analysis and identified as TFEB (peptide hits, 92).
(B) U87 cells were deprived of glucose for 1 h. Cytosolic and nuclear fractions were prepared. Immunoprecipitation with an anti-TFEB antibody was performed.
(C) Parental U87 cells and the indicated clones of cells with ACSS2 S659A, R664/665A, or T363K knock-in were infected with luciferase-reporter lentiviruses carrying four tandem copies of intact CLEAR elements. These cells were treated with or without glucose starvation for 10 h. Transcription was measured according to firefly luciferase activity. Luciferase activities were normalized to the cell numbers obtained from the duplicated samples. The data are presented as the mean ± standard deviation (SD) for triplicate samples.
(D) Parental and the indicated U87 cells with knock-in of ACSS2 S659A, R664/665A, or T363K mutant were deprived of glucose for 1 h. ChIP analyses using an anti-TFEB antibody were performed. The histogram shows the amount of immunoprecipitated DNA expressed as a percentage of the total input DNA. The data are presented as the mean ± SD for triplicate samples.
(E) Endogenous TFEB-depleted U87 cells with reconstituted expression of WT rTFEB or rTFEB R245/248A were treated with or without glucose starvation for 1 h. ChIP analyses were performed using an anti-ACSS2 antibody. The histogram shows the amount of immunoprecipitated DNA expressed as a percentage of the total input DNA. The data are presented as the mean ± SD for triplicate samples.
(F and G) Parental and the indicated U87 and U251 cells with knock-in of ACSS2 S659A, R664/665A, or T363K mutant were deprived of glucose for 10 h. Quantitative polymerase chain reaction (PCR) analysis (F) of the mRNAs of the indicated genes in U87 cells (F) and immunoblot analyses of U87 and U251 cells (G) with the indicated antibodies were performed. Data were normalized for β-actin mRNA levels and presented as fold changes induced by glucose deprivation (F).
(H) Parental and the indicated U87 cells with knock-in of ACSS2 S659A, R664/665A, or T363K mutant were deprived of glucose for 10 h. Quantitative PCR analysis of the mRNAs of the indicated genes was performed. Data were normalized for β-actin mRNA levels and presented as fold changes induced by glucose deprivation. The data are presented as the mean ± SD for triplicate samples.
(I) Parental and the indicated U87 or U251 cells with knock-in of ACSS2 S659A, R664/665A, or T363K mutant were deprived of glucose for 10 h. Immunoblot analyses with the indicated antibodies were performed.
See also Figures S3, S4, S5 and Tables S1, S2, S3.