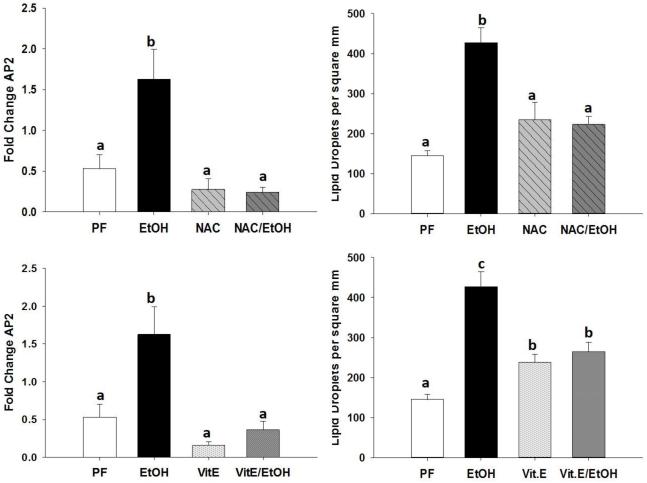
Figure 4.
Assessment of bone marrow adiposity by measuring (A and C) aP2 mRNA expression from femurs of PF-control mice, EtOH-fed mice, NAC-fed, NAC+EtOH fed, Vit.E-fed, and Vit.E+EtOH-fed mice. From H&E stained sections of tibias, number of marrow adipocytes per square millimeter were counted (B and D). Data are expressed as the mean ± S.E.M. Statistical significance was determined by two-way ANOVA followed by Student Newman-Keuls post hoc analysis. Values with different letter subscripts are statistically different from each other (p<0.05).

