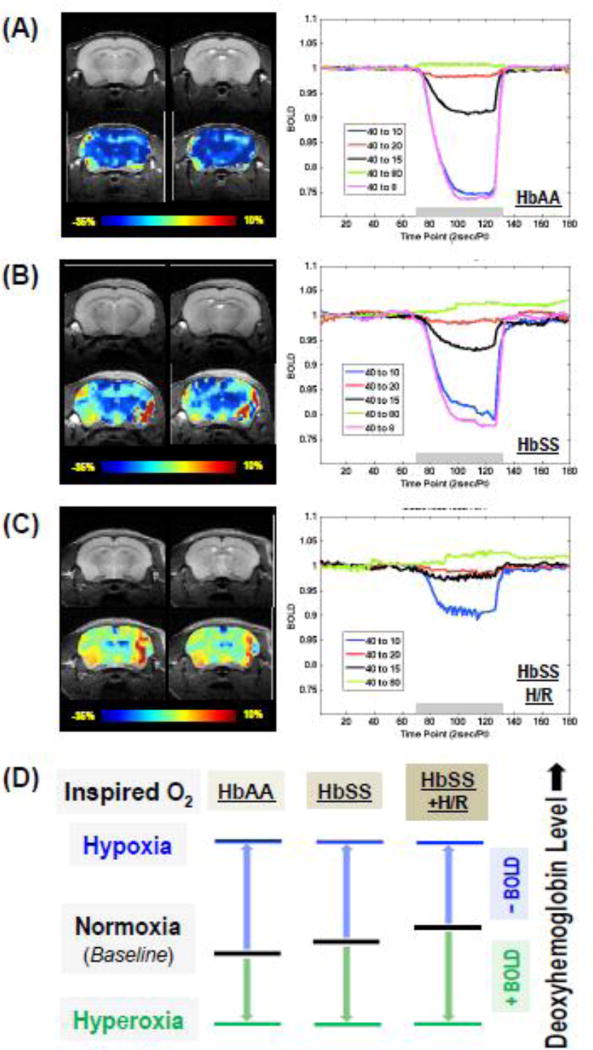
Figure 1. Sickle mice show decreased BOLD response to hypoxia.
Representative anatomical and BOLD fMRI images with FiO2 changed from 40% to 10% for 2 minutes (left panels in A–C, color bar indicates the BOLD response in percentage unit), as well as the BOLD time-course within a selected ROI in response to the hypoxia/hyperoxia manipulations (right panels in A–C, FiO2 at 40% as baseline and at 80/20/15/10/8% for 2 minutes during the hypoxia and hyperoxia as indicated by the gray bars) are shown for HbAA (A, n=6), HbSS (B, n=6) and HbSS pretreated with H/R (C, n=2) mice. Note: for ROI selection, the dark red colored areas in the fMRI maps were due to the imaging artifacts, and are excluded from the BOLD quantification. (D) Schematic illustration of the comprehensive correlations between the FiO2 and the change of venous deoxyhemoglobin content (it implies the BOLD percent change) in response to a severe hypoxia challenge or a high degree of hyperoxia; and the distinctions among HbAA control versus HbSS sickle mice with or without H/R. Abbreviations: BOLD, blood oxygen level-dependent; HbAA, HbAA-BERK control mice; HbSS, HbSS-BERK sickle mice; H/R, hypoxia/reoxygenation; Pt, point; sec, second; FiO2, fraction of inspired oxygen; ROI, region of interest.

