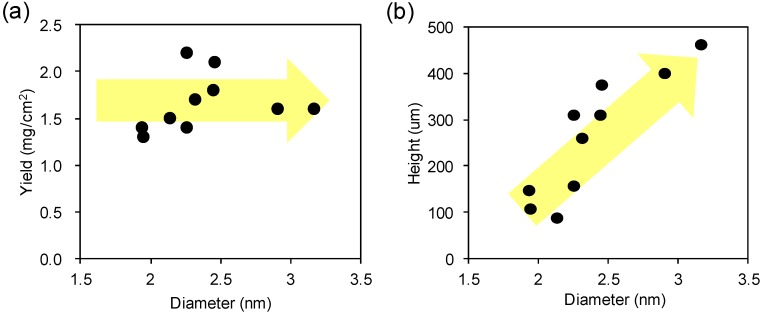
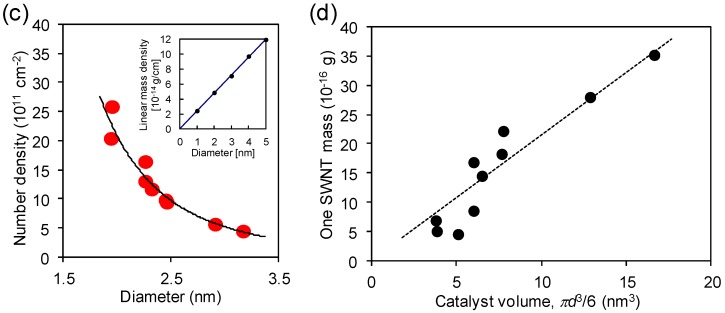
Figure 2.
(a) Plot of the yield versus the diameter of SWCNT; (b) Plot of the forest height versus the diameter of SWCNT; (c) A plot of the catalyst number density as a function of the SWCNT diameter. Dotted line represents an inverse cubic power law: , where n0 = 2.2 × 1013 cm−2 and d0 is 1 nm. Inset shows the Plot of linear mass density as a function of diameter; (d) Plot of the individual SWCNT mass versus the catalyst volume. Dotted line represents a linear relationship with a slope of 2 × 10⁻¹⁶ g/nm3.


