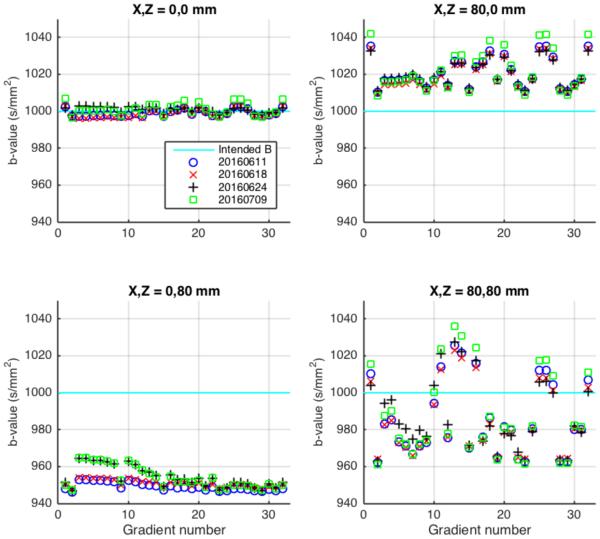
Figure 3.
The b-values predicted to be achieved in different locations relative to scanner isocenter for a 32-direction diffusion imaging sequence, shown relative to the intended b-value of 1000 s/mm2 (cyan). Different symbols indicate use of correction factors obtained from calibration scans made on 4 different dates. UPPER LEFT: Scanner isocenter. LOWER LEFT: 80 mm from isocenter along the longitudinal axis of the scanner bore. UPPER RIGHT: 80 mm from isocenter along the transverse axis. LOWER RIGHT: 113 mm from isocenter (80 mm displaced on both axes).

