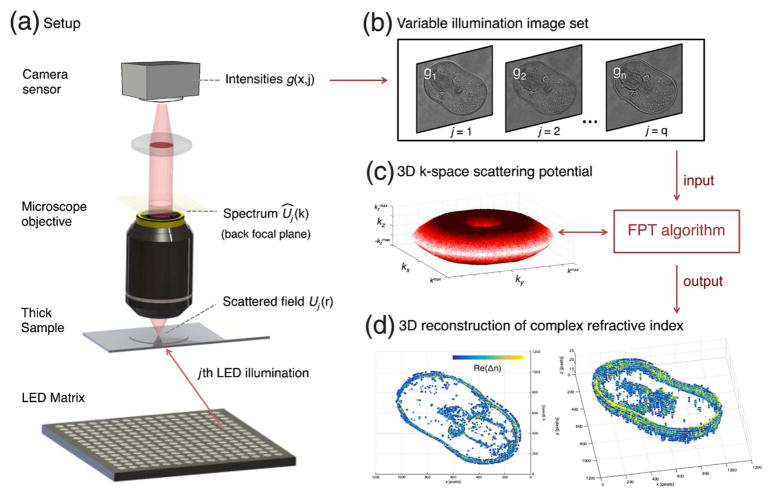
Fig. 1.
Setup for Fourier ptychographic tomography (FPT). (a) Labeled diagram of the FPT microscope, including optical functions of interest. (b) FPT captures multiple images under varied LED illumination. (c) A ptychography-inspired algorithm combines these images in a 3D k-space representation of the complex sample. (d) FPT outputs a 3D tomographic map of the complex index of refraction of the sample. Included images are experimental measurements from a starfish embryo (real index component, threshold applied; see Fig. 7).

