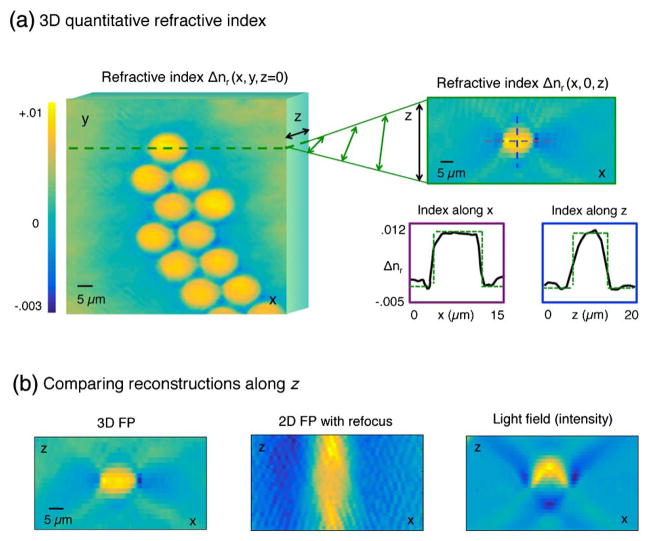
Fig. 4.
FPT quantitatively measures refractive index in 3D. (a) Tomographic reconstruction of 12 μm microspheres in oil with lateral (Δz = 0) slice on left, axial (Δy = 25 μm) slice on right, and one-dimensional plots of index shift along both x and z. (b) Digitally propagated FP reconstruction (middle) and refocused light field (right) created from the same data. FPT (left) best matches the expected spherical bead profile.

