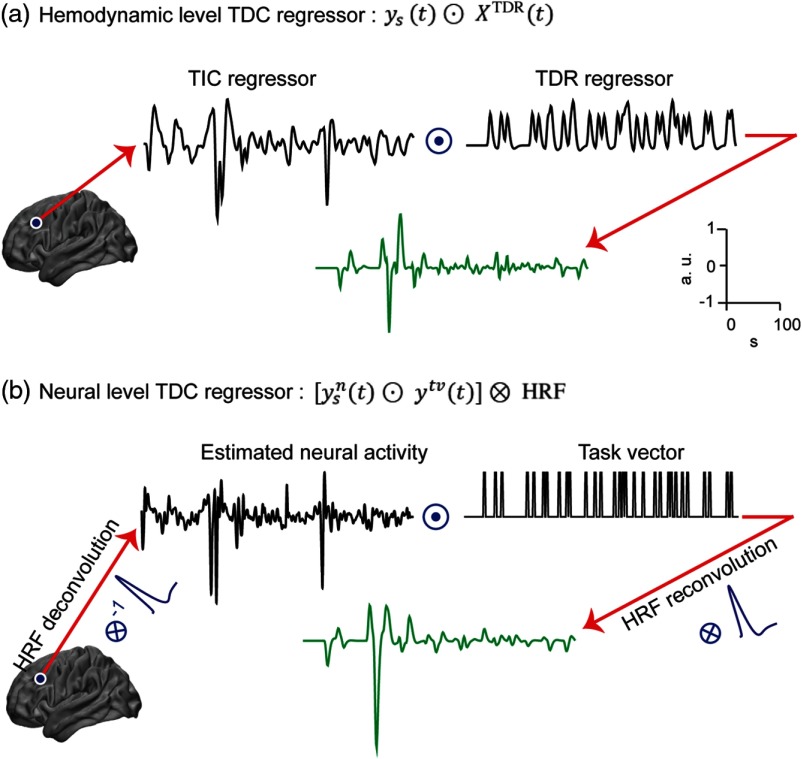
Fig. 3.
Procedure for making the TDC regressor (green curves) for PPI analysis. (a) At hemodynamic level: TDC regressor is simple componentwise multiplication () of the signal at seed location [TIC regressor, ] and response model to task [TDR regressor, ]. (b) At neural level: TDC regressor is built by first deconvolving HRF from the signal at seed location [TIC regressor, ] and multiplying the result [neural activity, ] into task vector (vector of ones and zeros, one for when stimulus/task is on) and reconvolving the result with the same HRF. The floating scale on the right side shows the scale of signals in and axes.

