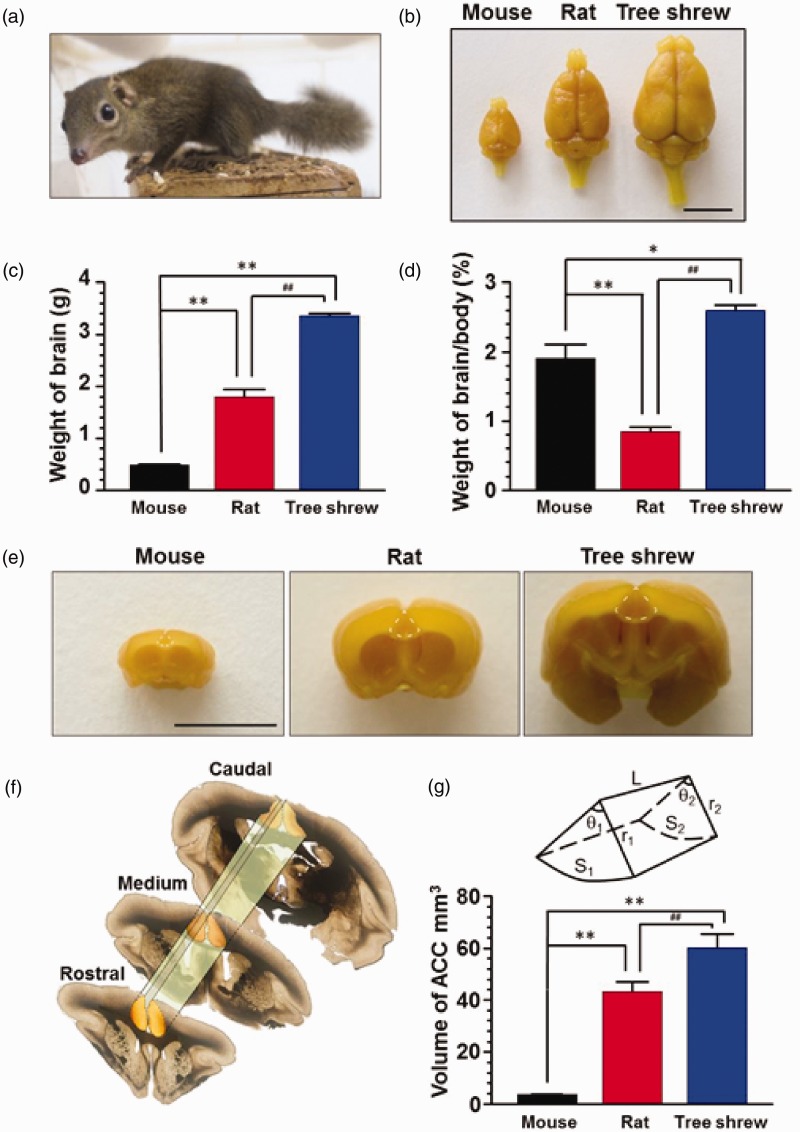
Figure 1.
The anatomical property of the brain in tree shrew. (a) A photo of tree shrew in daily life. (b) Fixed whole brain of mouse, rat and tree shrew. Scale bar, 1 cm. The weight (c) and proportion of brain (d) in tree shrew were much larger than that of mouse and rat (n = 9, 9, 8 for mouse, rat and tree shrew), *p < 0.05; **p < 0.01 in comparison with mouse, ##p < 0.01 in comparison with rat. (e) Representative coronal sections of forebrains in mouse, rat and tree shrew. The dash lines delineate ACC regions. Scale bar, 1 cm. (f) Sample sections showing the rostral, medium and caudal part of ACC in tree shrew. The integrated ACC was framed by dash lines. (g) The diagram showing the cylinder shape of ACC with sectorial section. S1, rostral areas of ACC; r1, radius of rostral ACC; θ1, degree of rostral ACC; S2, caudal areas of ACC; r2, radius of caudal ACC; θ2, degree of caudal ACC. Statistic results showing the volume of ACC was progressively increased in mouse, rat and tree shrew (n = 3 in each group), **p < 0.01 in comparison with mouse, ##p < 0.01 in comparison with rat.

