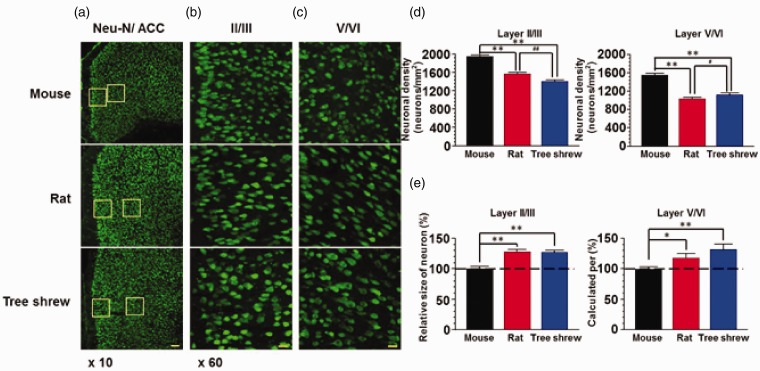
Figure 4.
The neuronal distribution in the ACC of tree shrew. (a) Fluorescence images of NeuN-immunostained neurons in the ACC of mouse, rat and tree shrew. The frames in (a) were magnified to show the layers II/III (b) and V/VI (c) of the ACC. Scale bar, 100 µm in (a) and 20 µm in (b–c). (d) Summarized data showing that the neuronal density in layers II/III and V/VI of rat and tree shrew was less than that of mouse (n = 24 slices/4 animals in each group). **p < 0.01 in comparison with mouse, #p < 0.05, ##p < 0.01 in comparison with rat. (e) The neuronal size in layers II/III and V/VI of rat and tree shrew was larger than that of mouse. *p < 0.05; **p < 0.01.

