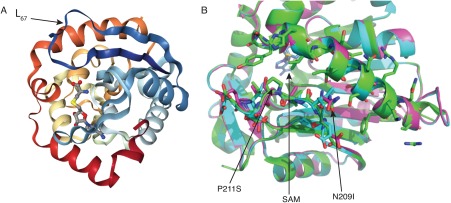
Figure 5.

Molecular modeling of NRMT1 mutants. (A) Full crystal structure of NRMT1. Arrow denotes loop67 (L67, navy blue) where N209 and P211 are located. The methyltransferase co‐factor S‐adenosyl‐methionine (SAM) bound to the active site is indicated in gray. (B) Model comparing wild type NRMT1 (green, PDB code 2EX4) to mutated NRMT1 (pink), as calculated by the Robetta server.29 Amino acids N209 and P211 are green and indicated by arrows, the N209I and P211S mutations are adjacent in pink. SAM bound to the active site is indicated in blue.
