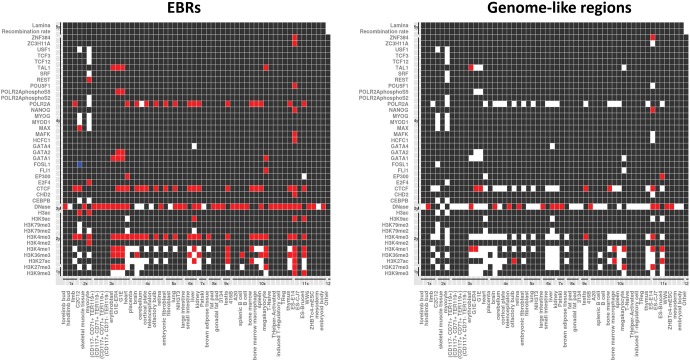
Fig. 4.—
Heat maps representing significant association found when comparing Rodentia EBRs (left panel) and control genome-like regions (right panel) with epigenetic modifications in 58 different mouse cell lines based on 10,000 permutation test with randomization (P-value < 0.05). Red squares indicate positive association (enrichment with P-value < = 0.05); white squares indicate no statistical association (P-value > 0.05), whereas blue squares indicate depletion (P-value < = 0.05). Black squares reflect no data available. The x-axis represents: (1x) Skeletal system, (2x) Muscular system, (3x) Circulatory system, (4x) Nervous system, (5x) Respiratory system, (6x) Digestive system, (7x) Excretory system, (8x) Endocrine system, (9x) Reproductive system, (10x) Lymphatic system, (11x) Stem cells, and (12x) Other. The y-axis shows: (1y) Histone modifications leading to “close” chromatin, (2y) Histone modifications associated with “open” chromatin, (3y) DNase-seq, (4y) Transcription factors, (5y) Other.

