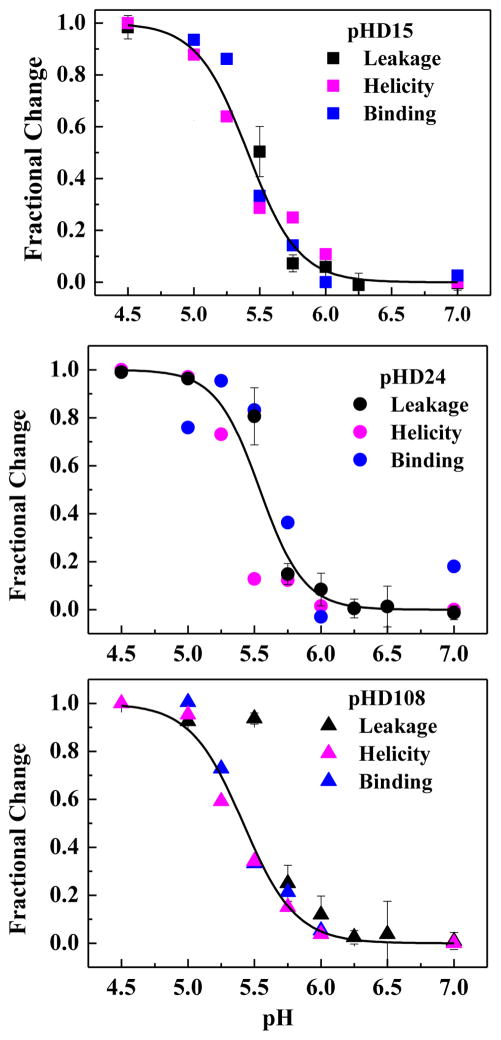
Figure 6.
Coupling of binding, structure and activity. For three pHD peptides we plot changes in TBD leakage, changes in α-helicity from CD, and changes in tryptophan fluorescence as pH is varied. All measurements are at P:L = 1:200. Curves represent the global fit for each peptide of a cooperative transition using all three data sets. There is little or no detectable difference between the pKa values for leakage, structure and binding, consistent with our hypothesis that they are coupled.

