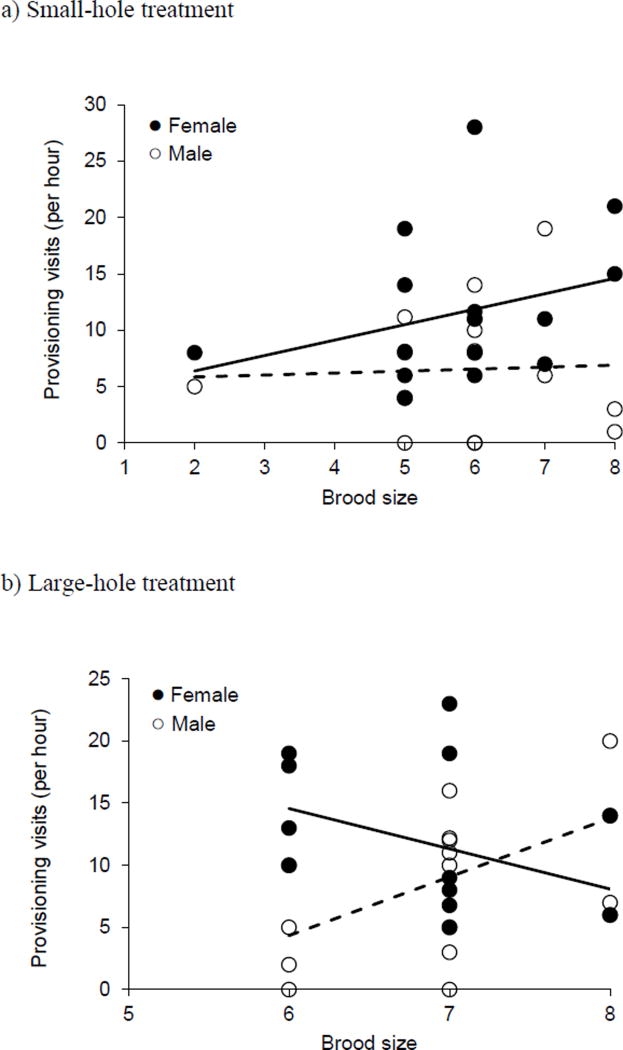
Fig. 3.
Nestling provisioning rates in relation to brood size in a small-hole treatments and b large-hole treatments. Note that the scale differs on the two x-axes. Each point represents an individual bird at an individual nestbox. Trend lines derived from linear regression (females are designated by solid lines and males by dashed lines).

