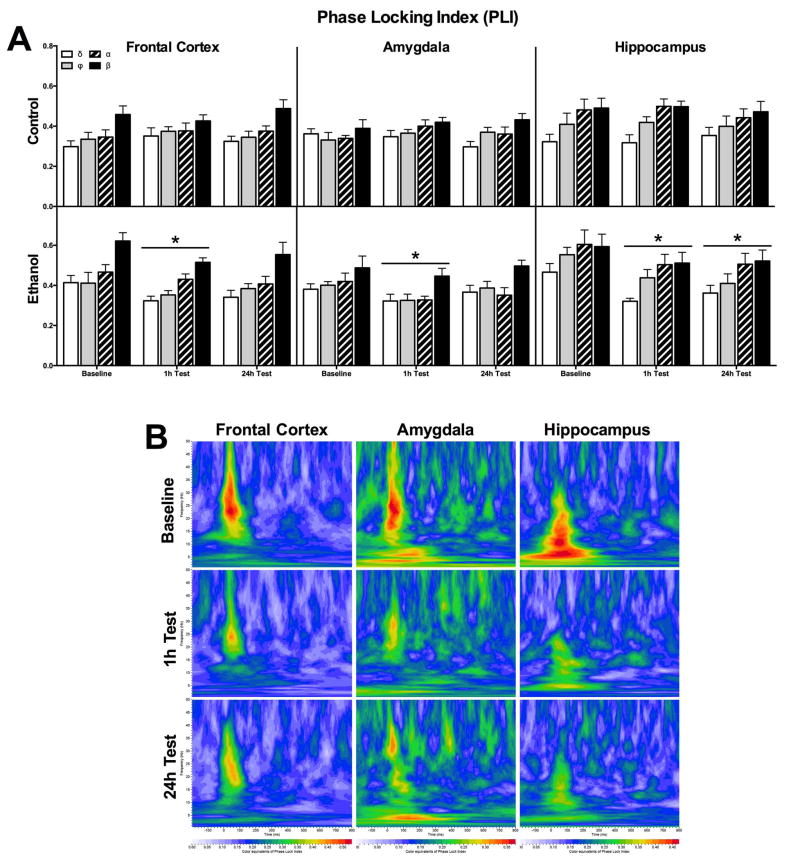
Figure 1.
Baseline phase-locking across electrode locations. (A) An example of hippocampal PLI in a color map plot with inlaid black outlines of the 4 a priori rectangular regions of interests (ROI) chosen (B) Baseline PLI values (mean ± SEM) for rats who would be given access to consume 20% ethanol (ethanol group) and/or water (control group) across the three electrode locations. There was significantly main effect of region with overall more phase-locking in the hippocampus compared to the amygdala. There was also a significant main effect of group with higher baseline PLI in the ethanol group compared to control group.

