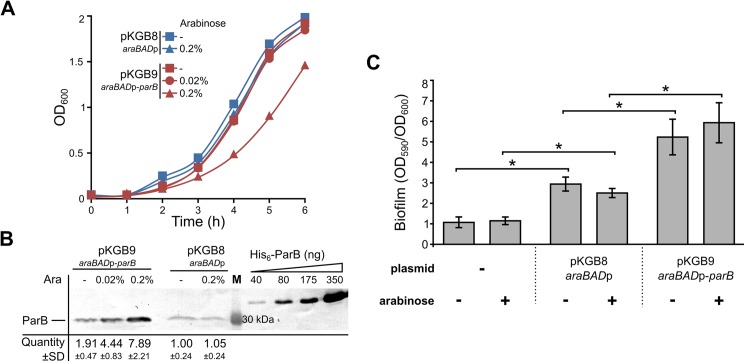
Fig 1. Effects of ParB excess in P. aeruginosa.
(A) Growth of P. aeruginosa PAO1161 (pKGB8 araBADp) and PAO1161 (pKGB9 araBADp-parB) strains in L broth with different arabinose concentrations. Data represent mean OD600. (B) Western blot analysis of ParB levels in the tested strains. Each lane contains extract from 109 cells. Blots were subjected to immunodetection using primary anti-ParB antibodies. Representative blot is shown. Signals on the blots were quantified. Data represent mean ParB level ±SD relatively to the control strain PAO1161 (pKGB8). Purified His6-ParB was used to generate standard curves. M–molecular weight marker. (C) Biofilm formation in the static cultures of PAO1161, PAO1161 (pKGB8) and PAO1161 (pKGB9). Strains were grown without or with 0.02% arabinose until OD600 0.5. Biofilm was stained with crystal violet and assessed by measurement of OD590. Data represent mean OD590/OD600 ratio ±SD from 3 biological replicates. *—p-value < 0.05 in two-sided Student’s t-test assuming equal variance.

