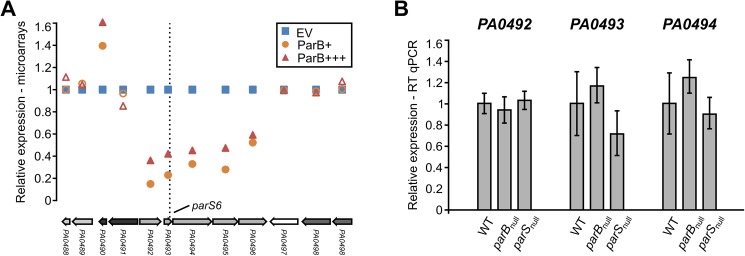
Fig 6. Influence of ParB level on expression of genes adjacent to parS6.
(A) Mean level of expression of PA0488–PA0498 genes in ParB+ and ParB+++ cells relative to EV cells (microarray data). Filled markers indicate statistically different expression relative to EV (p-value < 0.05 in ANOVA test). Operons (according to the DOOR 2.0 database [73]) are labelled with different shades of grey. (B) RT-qPCR analysis of expression of PA0492, PA0493 and PA0494 genes in parBnull and parSnull strains relative to WT cells. Data represent mean ±SD from three biological replicates. The differences between strains / conditions are not statistically significant (p-value > 0.05 in two-sided Student’s t-test assuming equal variance).

