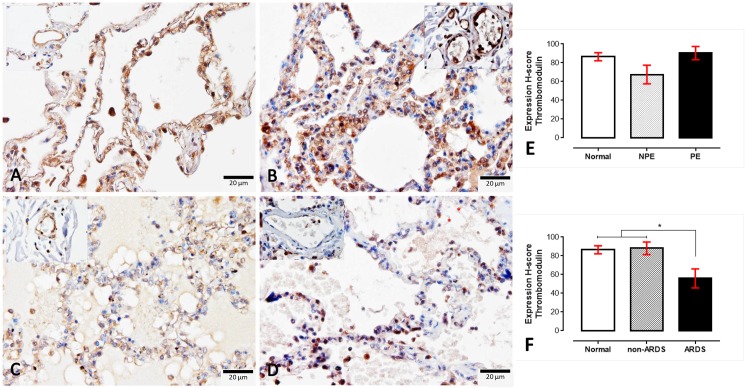
Fig 3.
Immunohistochemical staining for thrombomodulin in normal (A), non-PE (B), PE (C) and ARDS (D) lungs. The level of thrombomodulin expression in the small blood vessels are shown in the inset of each micrograph, The H-score expression is demonstrated by bar graphs for PE (E) or ARDS (F) lungs, to compare those expressions Friedman test was performed (*; p-value < 0.05).

