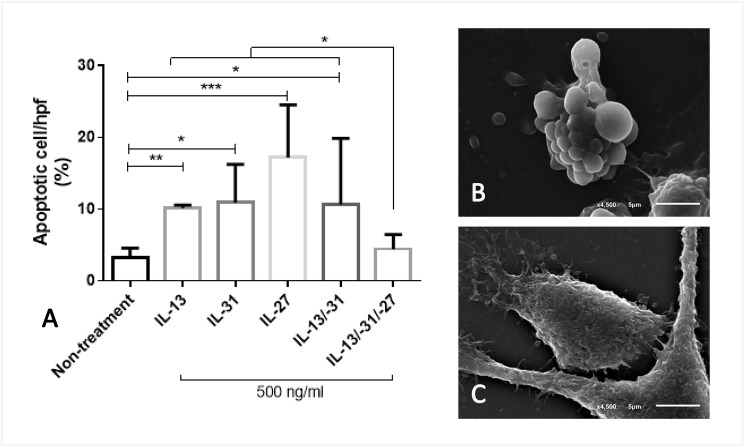
Fig 8. Percentage of apoptotic cells induced by cytokines.
The bar graph exhibited the difference in the number of apoptotic cells in each group using Friedman test (*; p-value<0.05, **; p-value <0.001, ***; p-value<0.001) (A) which was morphologically characterised by apoptotic (B) and normal cells (C).

