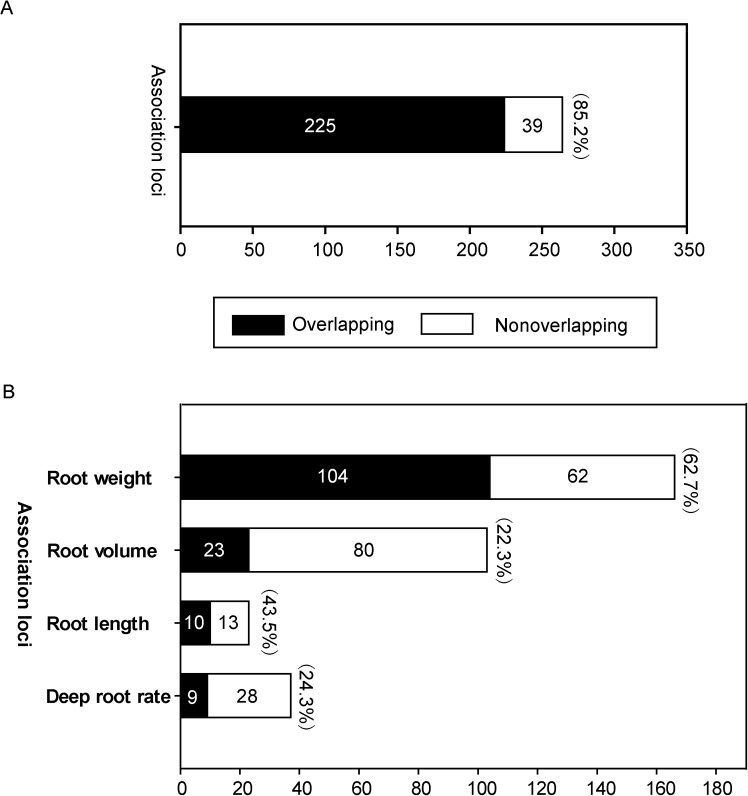
Fig 2. Root association loci overlapping with reported root QTLs.
Proportion of root association loci overlapping with reported QTLs for any root-related traits (A) and for the four categories of root traits (B), respectively. The black and white portions of each bar indicate the overlapping loci and nonoverlapping loci, respectively, and the overlapping percentage is shown in bracket at the top of each bar.

