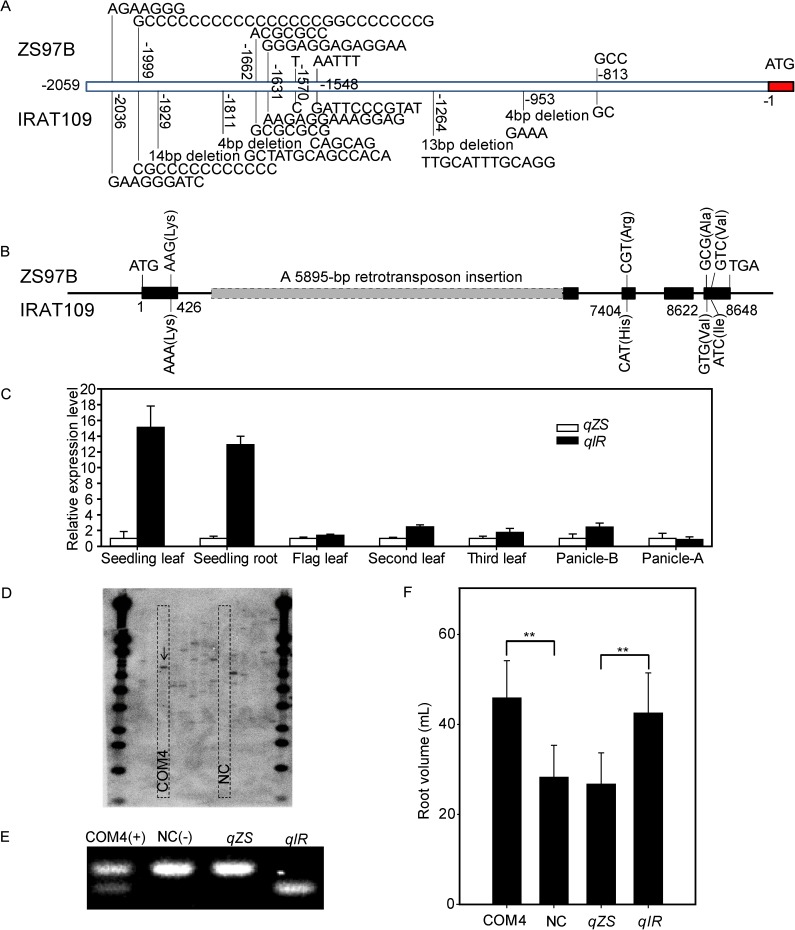
Fig 4. Sequence, expression and phenotypic analyses of Nal1.
(A) Sequence variations in the promoter (2 kb upstream of the start codon) of Nal1 between ZS97B and IRAT109. (B) Sequence variations in the ORF of Nal1 between ZS97B and IRAT109 (the corresponding amino acid changes are shown in parentheses). (C) Relative expression levels of Nal1 in different tissues of near isogenic lines (NILs) qZS and qIR at different stages. Panicle-B, panicle before heading; Panicle-A, panicle after heading; (D) Southern blot of complementary transgenic plants. Single copy line COM4 and negative control line NC are indicated by dashed boxes. (E) Genotypic identification of the complementary plants and NILs. (F) Root volume of the complementary lines and NILs. Data represent the mean ± SE (n = 10). **P < 0.01, Student’s t-test.

