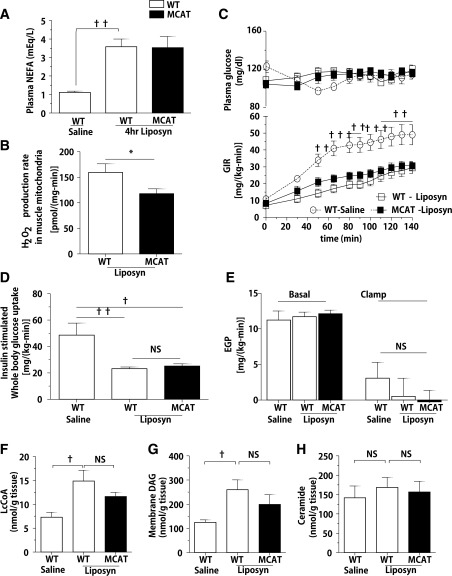
Figure 3.
Acute lipid infusion induces skeletal muscle insulin in both MCAT and WT mice. Body weight– and age-matched animals were fed RC and fasted overnight before 4 h of Liposyn infusion and hyperinsulinemic-euglycemic clamp study. A: Plasma nonesterified fatty acid (NEFA) concentration in MCAT and WT mice after 4 h of Liposyn infusion (n = 7–8) and saline infusion (n = 4). B: H2O2 production rate in isolated mitochondria from gastrocnemius skeletal muscle of MCAT and WT mice after 4 h of Liposyn infusion (n = 7–8). C: Plasma glucose concentration and GIR in MCAT and WT mice to maintain euglycemia during the clamp study with 3 mU/(kg-min) insulin infusion. D and E: Insulin-stimulated peripheral Rd and endogenous glucose production (EGP) rate in MCAT and WT mice (n = 4–8) during the clamp study. F–H: Intramuscular LcCoAs (n = 4–8), membrane DAG (n = 4–8), and ceramide (n = 4–8) content in gastrocnemius muscle after Liposyn infusion. Data are mean ± SEM. *P < 0.05 by Student t test; †P < 0.05, ††P < 0.01, †††P < 0.001 by two-way ANOVA in C and by one-way ANOVA in the other panels. NS, not significant.

