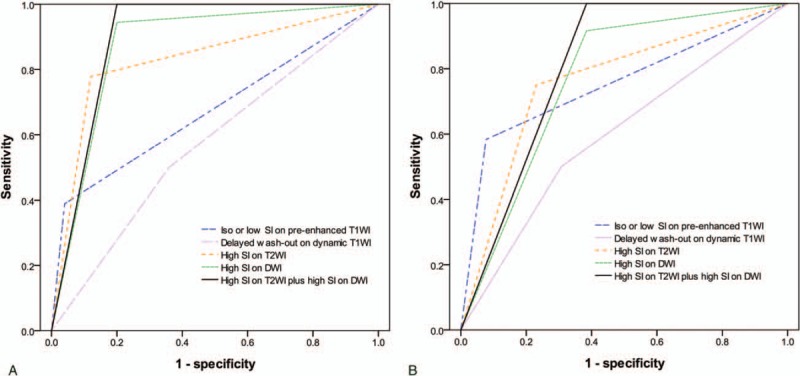
Figure 1.

ROC curves of Gd-EOB-DTPA-enhanced and diffusion-weighted MRI findings (A) for the differentiation of atypical small (≤3 cm) HCCs from dysplastic nodules, and (B) for the differentiation of Edmonson grade I HCCs from high-grade dysplastic nodules. DWI = diffusion-weighted imaging, Gd-EOB-DTPA = gadolinium-ethoxybenzyl-diethylenetriamine pentaacetic acid, HCC = hepatocellular carcinoma, MRI = magnetic resonance imaging, ROC = receiver operating characteristic, SI = signal intensity, T1WI = T1-weighted imaging, T2WI = T2-weighted imaging.
