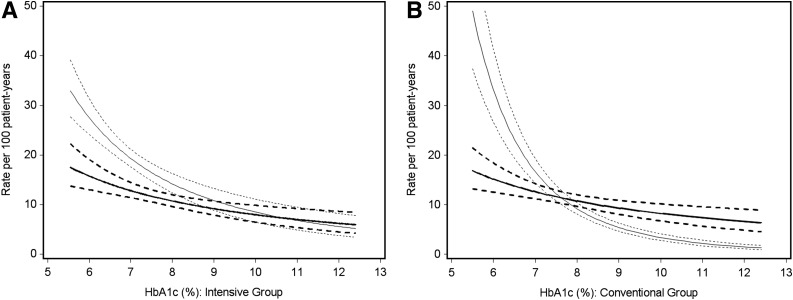
Figure 2.
Risk of any SH (first episode) as a function of the HbA1c values for the intensive treatment group (monthly during DCCT and annually during EDIC) (A) and conventional treatment group (quarterly during DCCT and annually during EDIC) (B). The regression line and its 95% confidence band are provided by the simple exponential Poisson models presented in Supplementary Table 2. Bold lines represent the EDIC period; light lines represent the DCCT period.

