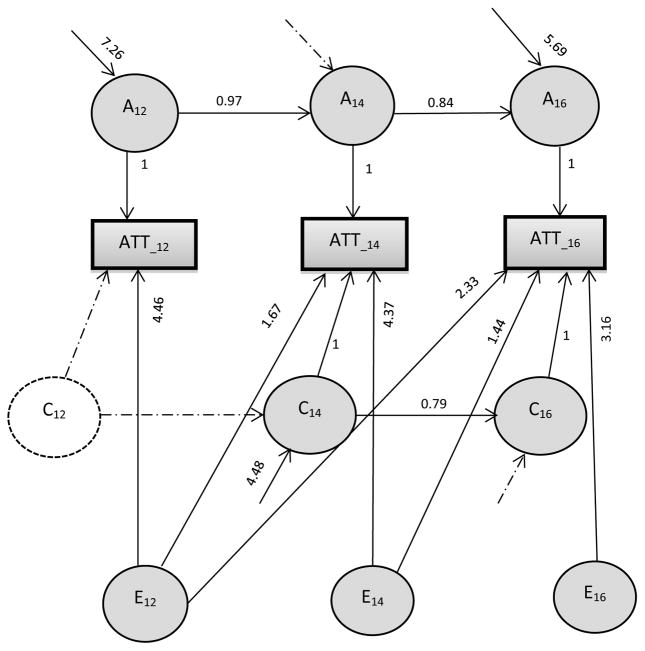
Figure 1. Best fitting structural equation model for genetic and environmental determinants of attention score, controlling for gender.
Note: Rectangles represent the observed variance for each age, and circles represent the latent factors. For additive genetic influences (A12, A14 and A16) and shared environmental influences (C12, C14 and C16), simplex model is shown. A Cholesky (triangular decomposition) model is shown for the non-shared environmental effects (E12, E14 and E16).

