
Figure 1. Kinetics of B16ova tumor growth.
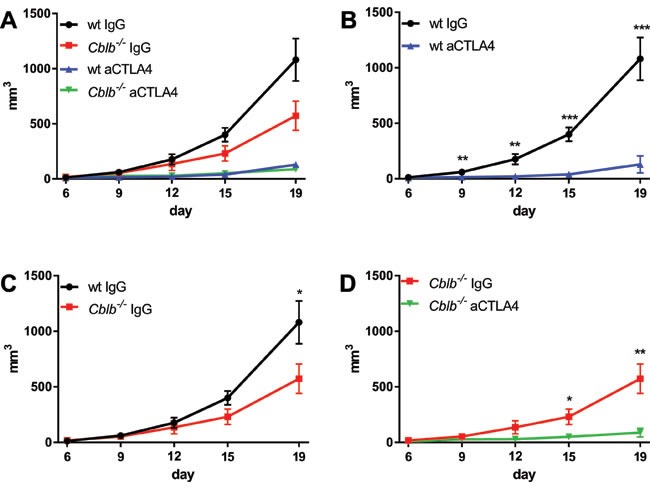
C57Bl/6 (wt) and Cblb−/− mice were s.c. injected with 5×10⁵ B16ova cells and i.p. injected with 400μg anti-CTLA4 or IgG control antibody every 3rd day starting on day 0. The data are pooled from two independent experiments (n = 6-7 per group). Tumor volume is shown.