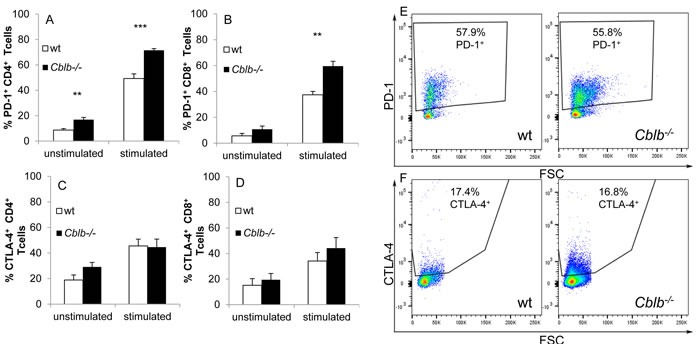
Figure 5. FACS analysis of T cells.

A.-D. CD3+ T cells of C57Bl/6 (wt) or Cblb−/− mice were cultivated overnight, either unstimulated or stimulated with 3μg/ml platebound anti-CD3 and 1μg/ml soluble anti-CD28. FACS analysis of CTLA-4 (C, D) and PD-1 (A, B) expression was performed on gated CD4+ (A, C) or CD8+ (B, D) cells. Mean +/− SEM of 4-6 individual mice is shown (3 independent experiments). E, F. PD-1 and CTLA-4 expression on tumor infiltrating CD8+ T cells. Dotblots are gated on CD45+ and CD8+ cells and percentage of PD-1+ or CTLA4+ cells is shown. One out of ten mice (four independent experiments) is depicted for each genotype.
