
Figure 7. IFNγ production of CD8.
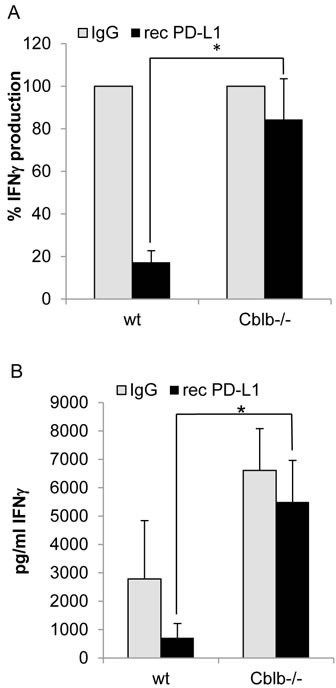
+ T cells. Cells were stimulated with 1μg/ml platebound anti-CD3 and 0.1μg/ml soluble anti-CD28. Additionally, wells were coated with 10μg/ml recombinant PD-L1 or IgG as control. Supernatants were taken on day 2 of cell culture and IFNγ was measured with Bioplex technology. A: Control value was set to 100%; B: Concentration in the supernatants. Mean ± SEM of 6-7 individual mice is shown (4 independent experiments).