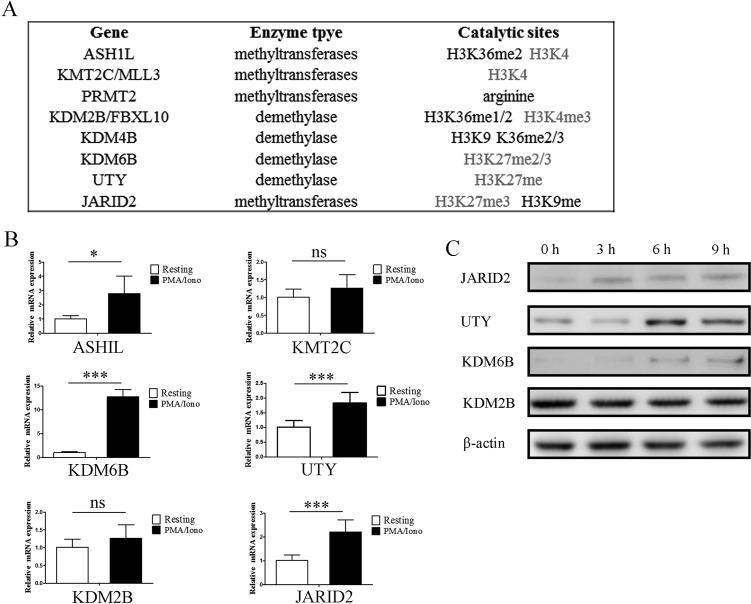
Figure 2. Gene expression of histone methytransferases and demethylases screened from microarray results were verified by qPCR and western blot.
A. The substrate specificities of the indicated enzymes. B. Verification of the microarray results by qPCR analysis of the indicated genes in NK92MI cells. Results are represented as fold change over control with glyceraldehyde 3-phosphate dehydrogenase (GAPDH) as a negative control. Error bars represent mean ± SD for three independent experiments (*p < 0.05, ***p < 0.01, and two-tailed unpaired t test). NK92MI cells were stimulated with PMA plus Ionomycin for 6 h. C. Verification of the microarray results by western blot of the indicated genes in NK92MI cells. NK92MI cells were stimulated with PMA plus Ionomycin for indicated time points.

