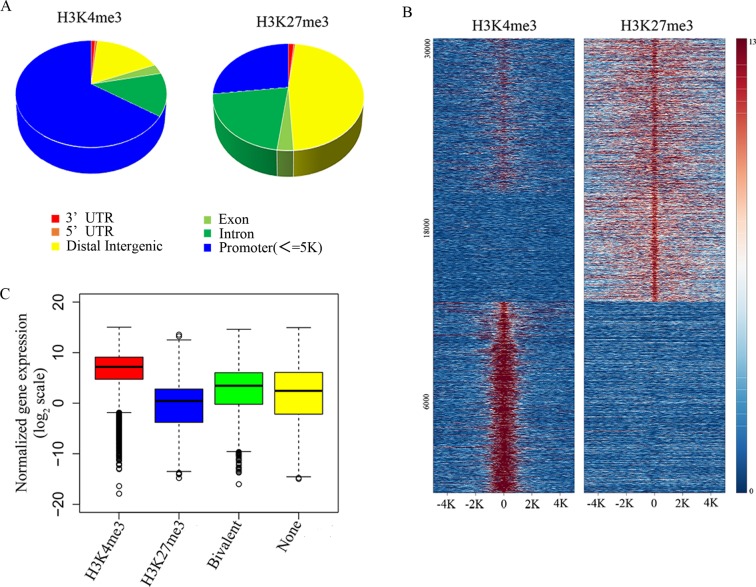
Figure 3. Identifying the relationship between histone modification states and gene expression levels in resting NK cells.
A. Genomic distribution of H3K4me3 and H3K27me3 modifications determined by ChIP-seq analysis. B. ChIP-seq density heatmap of H3K4me3 and H3K27me3 on their 30320 binding sites (y-axis) in a 5-kb window centered on gene transcription start sites. C. The box plot of normalized gene expression values in the microarray.

